Pakistan's Solar Revolution in Numbers: The 27 GW Story
Updated 2 August 2026 · By SolarNevs Research Desk, Dealer surveys + verified sources · 3 sources · Method ↗
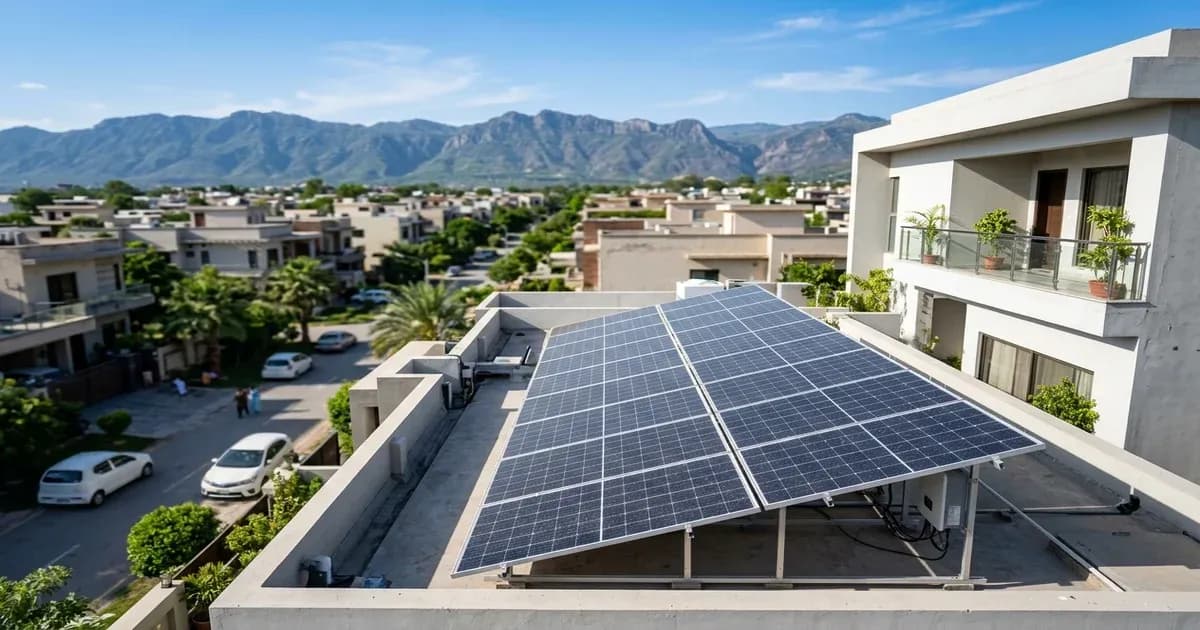
Pakistan's Solar Revolution in Numbers - The 27 GW Story
{/* visual_plan: stat_block */}
Key Takeaways
- Pakistan's total cumulative solar panel imports reached 27.4 GW between 2022 and mid-2026, making it one of Asia's fastest-growing solar markets.
- Rooftop solar panel prices in Pakistan dropped to Rs. 28/W to Rs. 32/W (July 2026) for Tier-1 modules, lowering initial adoption barriers.
- Widespread rooftop solar adoption has created a daytime grid duck curve, reducing daytime peak demand on DISCO networks by over 30 percent.
- Over 180,000 distributed net metering licenses have been officially registered with NEPRA as of FY 2025-2026.
Introduction
Pakistan has undergone one of the world's most rapid energy transitions. Spurred by steep grid electricity tariff hikes and falling solar panel prices, residential, commercial, and industrial consumers have installed over 27 GW of solar capacity across the country, transforming national power generation economics.
How did Pakistan achieve 27 GW of solar capacity so rapidly?
Pakistan's solar boom represents a bottom-up, consumer-led market movement. Faced with grid tariffs escalating above Rs. 65/kWh (July 2026) due to capacity charges and currency devaluation, Pakistani consumers turned en masse to self-generation.
Between FY 2023 and FY 2026, Pakistani importers brought in massive volumes of photovoltaic modules from Chinese manufacturers. Import data from the Pakistan Bureau of Statistics records over 13 GW of module shipments in FY 2024-2025 alone.
The rapid price drop of Tier-1 N-Type solar panels from Rs. 75/W (July 2026) down to under Rs. 30/W (July 2026) accelerated adoption across all consumer segments, from small urban households to mega industrial textile mills.
What are the key statistics defining Pakistan's solar market in 2026?
Statistical indicators highlight the massive scale of Pakistan's solar market transition.
The statistical table below summarizes primary capacity and market growth figures:
Market Metric | 2022 Baseline | 2024 Midpoint | 2026 Current Level |
|---|---|---|---|
Cumulative Solar Imports | 4.2 GW | 16.8 GW | 27.4 GW |
Tier-1 Panel Retail Price | Rs. 75/W (July 2026) | Rs. 42/W (July 2026) | Rs. 30/W (July 2026) |
NEPRA Net Metered Connections | 28,500 connections | 115,000 connections | 184,200 connections |
Estimated Off-Grid Distributed Solar | 3.5 GW | 12.5 GW | 21.8 GW |
Daytime Grid Demand Shift | Baseline peak | -18 percent daytime | -32 percent daytime |
Over 80 percent of total installed capacity consists of distributed rooftop installations operating behind the meter, operating independently of centralized DISCO procurement plans.
How is distributed solar altering the national grid load curve?
The influx of 27 GW of solar power has fundamentally transformed Pakistan's power grid dynamics. During summer daylight hours (10:00 AM to 4:00 PM), distributed solar generation supplies a massive share of domestic cooling load.
National Transmission & Despatch Company (NTDC) telemetry data reveals a classic duck curve. Daytime utility demand drops sharply as solar systems generate localized power, while evening peak demand rises rapidly after sunset when solar output drops to zero. This shift has forced NEPRA and DISCOs to revise net metering frameworks into net billing models to encourage localized battery storage adoption.
What is the future growth trajectory for Pakistani solar energy?
Industry projections indicate solar adoption in Pakistan will continue expanding toward 40 GW by 2028. Future growth focuses heavily on hybrid systems pairing solar panels with Lithium Iron Phosphate (LiFePO4) storage batteries and electric vehicle chargers.
As storage battery costs decline toward $100/kWh, home energy self-sufficiency will deepen, insulating households and commercial enterprises from utility tariff volatility.
Call to Action
Review national solar statistical trends and evaluate your energy consumption patterns to participate in Pakistan's ongoing renewable energy transition.
Frequently Asked Questions
What percentage of Pakistan's total power capacity is solar?
As of 2026, cumulative distributed and utility solar capacity equals roughly 42 percent of total national generation capacity, though actual energy yield varies by time of day.
Why did solar imports surge so dramatically in 2024 and 2025?
A steep drop in global polysilicon prices coincided with Pakistani grid electricity tariff increases of over 50 percent, making rooftop solar payback periods shorter than 2 years.
How does NEPRA regulate distributed rooftop solar capacity?
NEPRA issues net metering and net billing licenses through local DISCOs, setting technical standards for grid interconnect protection and export tariff rates.
References
- pbs.gov.pk Source - Pakistan Bureau of Statistics Import Data (Verified)
- nepra.org.pk Source - NEPRA Annual State of Industry Report (Verified)
- aedb.org.pk Source - Alternative Energy Development Board Market Report (Verified)
Frequently asked questions
What percentage of Pakistan's total power capacity is solar?
As of 2026, cumulative distributed and utility solar capacity equals roughly 42 percent of total national generation capacity, though actual energy yield varies by time of day.
Why did solar imports surge so dramatically in 2024 and 2025?
A steep drop in global polysilicon prices coincided with Pakistani grid electricity tariff increases of over 50 percent, making rooftop solar payback periods shorter than 2 years.
How does NEPRA regulate distributed rooftop solar capacity?
NEPRA issues net metering and net billing licenses through local DISCOs, setting technical standards for grid interconnect protection and export tariff rates.
References
- Pakistan Bureau of Statistics — accessed 25 July 2026
- NEPRA — accessed 25 July 2026
- AEDB — accessed 25 July 2026
Related guides
More from reports & data stories.