9kW Solar System Australia: Cost, Panels, Output, and Payback
Updated 19 September 2026 · By SolarNevs Research Desk, Dealer surveys + verified sources · 2 sources · Method ↗
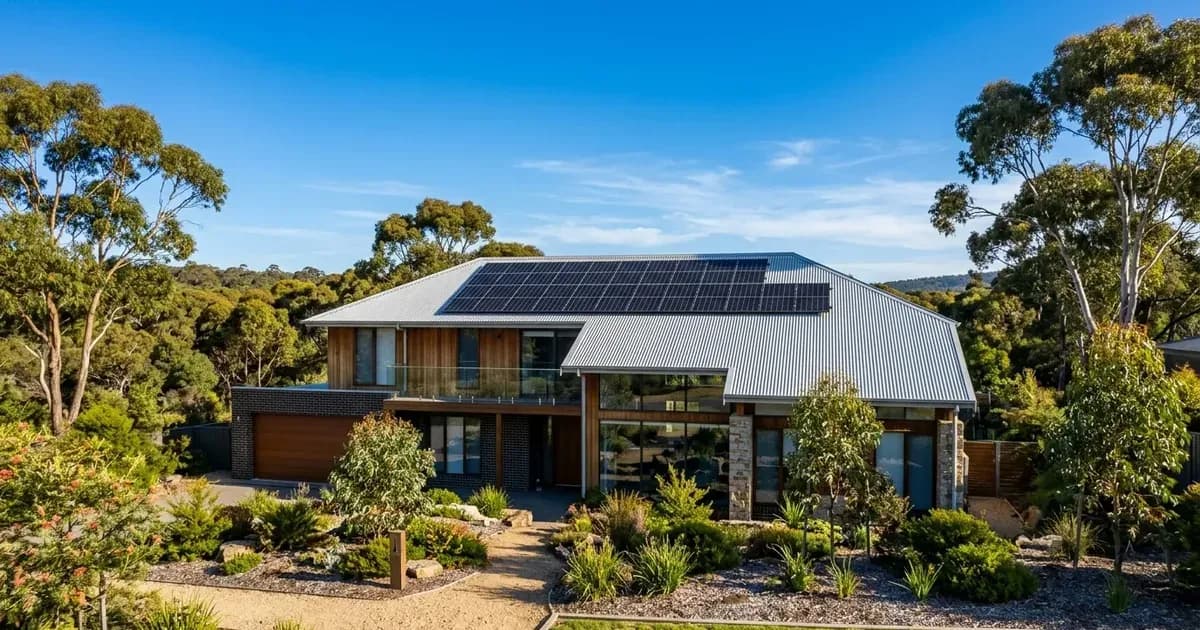
A 9kW solar system represents a substantial residential renewable energy installation in Australia. Ideal for large multi-storey homes, all-electric households, properties with electric vehicle charging, and premises operating ducted air conditioning or swimming pool filtration, a 9000-watt array generates abundant clean power to eliminate high daytime electricity bills.
Understanding required panel counts, roof dimensions, capital city installation prices, daily electricity generation, and financial returns helps homeowners make a well-informed investment.
9kW System Hardware, Panel Count, and Roof Space Requirements
Configuring a 9kW array requires evaluating roof surface geometry and module power ratings:
- Panel Count: For a 9kw solar system (or 9000 watts) you will require 23-27 solar panels. These days solar panels usually come in rated somewhere between 330 watts (w) to 400w. Using higher-wattage modules reduces the required panel count.
- Individual Panel Area: Each panel generally measures out to 1.7m 2.
- Total Roof Space: For a typical 9kw solar system you will require between 39 - 46m 2 of roof space depending on the panels you use.
- Electrical Connection Safety: A 9kW system typically pairs with an 8kW or 10kW inverter. Grid connection must be performed by a Clean Energy Council (CEC) accredited installer in accordance with Australian standards. Unqualified persons should never handle live DC isolators or open switchboard cabinets.
Turnkey Installation Costs Across Australian Capital Cities
Solar system costs in Australia benefit from federal incentives that reduce out-of-pocket expenses. Benchmark data shows two pricing perspectives:
- National Benchmark Method: The September 2025 price index shows that the average dollar-per-watt price for a fully installed 10kW system was about $1.04 per watt. Applying this benchmark to a 9kw system gives an indicative cost of $9353 ($1.04 x 9000w).
- City-Level Average: Looking at the simple average of capital city price data gives a lower figure of around $7470, reflecting competitive metro installation packages:
Capital City / Territory | Installed Cost (Incl. STC & GST) | Cost per Installed Watt |
|---|---|---|
Canberra (ACT) | $6,790 | $0.96 / W |
Adelaide (SA) | $6,810 | $0.87 / W |
Sydney (NSW) | $6,830 | $0.86 / W |
Brisbane (QLD) | $7,270 | $1.05 / W |
Perth (WA) | $7,420 | $1.03 / W |
Melbourne (VIC) | $7,500 | $0.91 / W |
Hobart (TAS) | $9,650 | $1.24 / W |
Canberra records the lowest turnkey price at $6,790, followed closely by Adelaide at $6,810 and Sydney at $6,830. Brisbane averages $7,270, Perth records $7,420, and Melbourne sits at $7,500. Specialised freight and logistics make Hobart higher at $9,650.
Daily and Annual Electricity Generation by Capital City
Electricity generation varies across states based on regional solar irradiance. Sizing calculations conservatively assume that the system's efficiency is 75% for the whole system to account for heat derating, dirt soiling, inverter losses, and cabling resistance:
Capital City | Average Daily Production | Estimated Annual Production |
|---|---|---|
Darwin (NT) | 39 kWh per day | 14454 kWh per year |
Perth (WA) | 38 kWh per day | 13797 kWh per year |
Brisbane (QLD) | 36 kWh per day | 13140 kWh per year |
Adelaide (SA) | 35 kWh per day | 12647 kWh per year |
Canberra (ACT) | 35 kWh per day | 12647 kWh per year |
Sydney (NSW) | 33 kWh per day | 11826 kWh per year |
Melbourne (VIC) | 30 kWh per day | 11005 kWh per year |
Hobart (TAS) | 28 kWh per day | 10184 kWh per year |
Darwin and Perth achieve the highest output in the country, delivering 39 kWh per day (14454 kWh per year) and 38 kWh per day (13797 kWh per year) respectively. Brisbane generates 36 kWh per day (13140 kWh per year), while Adelaide and Canberra both produce 35 kWh per day (12647 kWh per year). Sydney yields 33 kWh per day (11826 kWh per year), Melbourne delivers 30 kWh per day (11005 kWh per year), and Hobart produces 28 kWh per day (10184 kWh per year).
Financial Returns and Payback Schedules
Financial performance reflects household self-consumption patterns. Assuming an active household energy usage of 40 kWh per day and a 40% daytime self-consumption profile, returns across major capitals show strong investment metrics:
Capital City | System Cost | Grid Tariff / FiT | Annual Bill Savings | Payback Period | Annual IRR |
|---|---|---|---|---|---|
Adelaide (SA) | $6,810 | 35c / 8c | $2,356 | 2.9 years | 36% |
Sydney (NSW) | $6,830 | 29c / 7c | $1,997 | 3.4 years | 30% |
Canberra (ACT) | $6,790 | 29c / 7c | $1,791 | 3.8 years | 27% |
Perth (WA) | $7,420 | 31c / 6c | $1,956 | 3.8 years | 27% |
Brisbane (QLD) | $7,270 | 26c / 6c | $1,611 | 4.5 years | 23% |
Hobart (TAS) | $9,650 | 33c / 8c | $2,094 | 4.6 years | 22% |
Melbourne (VIC) | $7,500 | 22c / 5c | $1,529 | 4.9 years | 20% |
- Adelaide: Generates $2,356 in first-year savings on a $6,810 system, paying back in just 2.9 years with a 36% IRR.
- Sydney: Saves $1,997 annually on a $6,830 outlay, achieving payback in 3.4 years with a 30% IRR.
- Canberra and Perth: Deliver payback in 3.8 years, saving $1,791 and $1,956 per year respectively.
- Brisbane: Produces $1,611 annual savings, paying back in 4.5 years with a 23% return.
- Hobart and Melbourne: Achieve full capital recovery in 4.6 and 4.9 years respectively.
Small-scale Renewable Energy Scheme (SRES) Eligibility
A 9kW solar system qualifies for federal financial support administered by the Clean Energy Regulator (CER):
- Capacity Limit: Systems must have a capacity less than 100 kW. A 9kW array is well below this limit.
- Generation Ceiling: The installation must have a total annual electricity output less than 250 MWh. A 9kW system produces approximately 10 to 14.5 MWh per year.
- Accreditation: All panels and inverters must be CEC-approved and installed by an accredited installer.
Documentation Gaps and Sizing Considerations
- The documentation does not detail 9kW three-phase inverter export limiting variations by distributor. Some suburban distribution networks mandate dynamic export curtailment when inverter capacities exceed 5kVA on single-phase connections.
- Homeowners with three-phase power supplies can connect a balanced 9kW array seamlessly across all phases, ensuring maximum grid stability.
Frequently asked questions
How many panels and roof space are needed for a 9kW solar system?
A 9kW solar system (9000 watts) requires between 23 and 27 solar panels rated from 330W to 400W, needing approximately 39 to 46 m2 of unshaded roof space.
What is the average installed cost of a 9kW solar system in Australian capital cities?
Typical metro pricing averages around $7,470, ranging from $6,790 in Canberra and $6,810 in Adelaide to $7,500 in Melbourne and $9,650 in Hobart.
What daily electricity output and payback period can owners expect from a 9kW array?
Daily output ranges from 28 kWh in Hobart to 38 kWh in Perth and 39 kWh in Darwin, delivering financial payback in 2.9 to 4.9 years at 40% self-consumption.
References
- Solar Choice - 9kW Solar System Sizing, Output, and Pricing — accessed 28 August 2026
- Clean Energy Regulator - Rooftop Solar Small-scale Renewable Energy Scheme — accessed 28 August 2026
Related guides
More from what to buy — and how not to get cheated.